This one has graphic visual information as well as textual info that fills in more detail. Together they create a balanced effect between positive and negative space and make an interesting read.
Another one that combines images with text- this is more conventional though, the way the items are displayed in rows. Notice how there are categories of frozen desserts.
this one is different. No language at all.
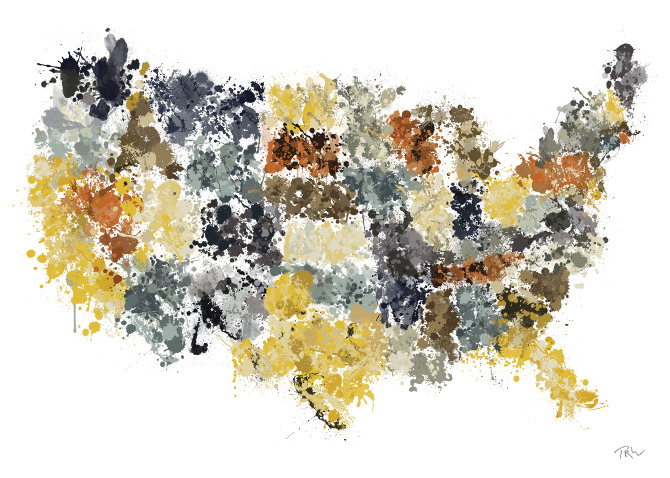
this does not have much information per se, but illustrates another way of showing political boundaries


No comments:
Post a Comment
Note: Only a member of this blog may post a comment.